

The Polymerase Chain Reaction (PCR)
PCR is an incredibly versatile protocol. Mastery of this technique unlocks a cornucopia of tools for genetic manipulation. Pay attention to your early failures and always seek to find out WHY they failed so you can develop the correct heuristics for more complicated reactions.
Equipment and Consumables:
.dna Map of the Region you plan to replicate, complete with information about primer binding, and length of amplicon
Length of Amplicon = Distance between the 5’ ends of each primer
Extension time = Number of Nucleotides to Amplify (bp) ÷ Speed of polymerase (bp/min)
Anything larger than ~5 kb is going to be difficult to amplify, even for an experienced user – success here requires using a fancy polymerase, *excellent* primers (well-designed, no dimers/hairpins), clean and high-quality template with high signal:noise ratio, fresh reagents, and excellent hands-on technique. In theory, PCR products up to ~20 kb are possible, but these are extremely difficult to obtain in practice.
Tm = Temperature at which 50% of primers will be bound, and 50% unbound
You want an annealing temperature somewhere around the Tm
You need primers that have a relatively similar Tm or you’ll get a lot of non specific product
‘Rule of Thumb’ Annealing temperature = Tm - 5
DNA Polymerase
Stolen from nature, this protein will be stitching the DNA together from the raw nucleotides, based upon the template you provide.
Example Polymerase speeds:
Taq DNA Polymerase: 2000 bp/min
Pfu DNA Polymerase: 500 bp/min
Appropriate DNA Polymerase Buffer
Provides a native environment that tricks DNA polymerase into working. This will come packaged with a commercial polymerase.
Primer 1 and Primer 2
Fragments of DNA, ~20-30 base pairs in length, which will be used to start off the polymerase chain reaction in each cycle.
I generally order these as single stranded DNA oligos from IDT.
Ideally use well established and understood primers when first learning PCR. Primer design is a challenging art and involves a bit of luck. Most plasmids will have standardised primers associated with them.
Certain primer pairs may be non-complementary because they associate more easily with each other than your target DNA strand/plasmid. This will result in a thick band between ~30-100 bp mark on your agarose gel and little/no product of the desired size.
There are other causes for the dreaded Primer Dimer band, and it can often be fixed by adjusting your annealing temperature. Don’t go changing out the primers just because you’ve got one appearing on your gel. However if it’s still there after trying a gradient of temperatures, you may need to try a different pair of primers
dNTPs
These are literally just raw nucleotides; A, C, G, T
DNA Template
An ideal DNA template is purified DNA, such as a plasmid that has undergone the Miniprep protocol or a commercial sample.
A less ideal template would be a genomic sample purified through the Boil Purification method, but this should definitely still work with a robust polymerase like Taq.
The dirtiest sample would be raw cells, such as during a Colony PCR. Always use a robust polymerase like Taq for colony PCRs. The polymerase is able to gain access to the DNA inside the cells thanks to the initial 95°C denaturation step.
Ice in an ice box
Set-Up Protocol:
NOTES FROM NICK: The usual PCR is 25 µl volume, this is appropriate for “screening” purposes. However, if you are trying to make a lot of PCR product for cloning, then scale reactions up to 50 µl per tube. A PCR that is working well should give you about 50 ng of product per µl of reaction, thus 2.5 µg per 50 µl. For a cloning experiment, if you prepare 8 x 50 µl PCRs, this should give you plenty of insert DNA (10-20 µg), even if your PCR is not working at high efficiency. This is way in excess of the theoretical requirement, but allows for losses due to subsequent purification steps, and the likelihood that you may need to repeat the experiment a few times :-/
master mix preparation
With PCR we set up our reactions as a “Master Mix” that contains everything except the variable. We then seperate the master mix into individual reactions and add our variable. Usually our variable is the DNA template, but sometimes it is the primer. The ‘Master Mix’ should be made to include everything except the variable being tested. The below protocol and above recipes are written assuming that this variable is the DNA; you need to modify if the same template is being tested with multiple primers, or the same primer/template is being tested with multiple polymerases.
EXAMPLE 8 REACTION MASTER MIX
(Rxn Volumes x 9 (#Reactions + 1 for pipetting tolerance)
180 µl Sterile dH2O
22.5 µl 10x buffer (1 x)
4.5 µl 10 mM dNTPs (200 µM)
2.25 µl 50 µM Primer #1 (0.5 µM)
2.25 µl 50 µM Primer #2 (0.5 µM)
2.25 µl (5 U/µl) DNA Polymerase (0.05 U / µl)
(DNA template: 8 x 1 µl)
Added after master mix distribution
EXAMPLE 25 µl REACTION MIX (Final Conc.)
(Amount pipetted in each PCR tube after MM)
20 µl Sterile dH2O
2.5 µl 10x buffer (1 x)
0.5 µl 10 mM dNTPs (200 µM)
0.25 µl 50 µM Primer #1 (0.5 µM)
0.25 µl 50 µM Primer #2 (0.5 µM)
0.25 µl (5 U/µl) DNA Polymerase (0.05 U / µl)
(DNA template: 1 µl)
Added after master mix distribution
reaction set-up
Calculate how many PCRs you need altogether, and thus the total volume of master mix required. It’s important to make more than you need (~10% more), as pipetting errors will always change the expected volumes a little bit. As a general rule, calculate (number of reactions you need + 1) and then multiply the volumes in the above left hand column to get the required volumes for your master mix.
Remember to exclude your variable from the master mix - we will add it later!
Remember to reserve a reaction tube for your negative control.
If you don’t think you have a variable - it is the DNA template. You will add it last and keep one tube empty as a negative control (no template added).
Label your strip tubes (1, 2, 3, 4, …, n) on the side, at the top (under the lip of the lid). If you label the lids or the bottom of the tube, the labels tend to come off during thermocycling. Place the tubes in a tube-rack (a 96-well microtiter plate works well) and push this tube rack into the ice of your ice box so that the bottoms of the tubes remain cool. Leave the lids off the tubes – you are more likely to contaminate the reactions via excessive opening and closing of tubes than from stuff falling in from the air.
Retrieve the PCR reagents from the -20°C freezer and thaw them (except polymerase, this remains liquid even at -20°C due to glycerol in buffer). Its important that the 10x buffer, dNTPs, and primers are thoroughly thawed out before use. Give them a brief vortex or flick to mix. After thawing these reagents should be kept on ice during the time needed to set up the PCR, don’t leave them on the bench longer than needed.
Prepare the master mix in a sterile Eppi tube, containing everything except the DNA template. Add ingredients in the order listed in the recipes above.
Some folks will insist that this must be done on ice, opinions differ.
It is true that you will minimise premature polymerase activity by setting up on ice, but whether this really makes a difference for most PCRs is arguable.
Setup on ice is supposedly more important for Pfu and Phusion which contain 3’-5’ exonuclease activity which can ‘eat’ your primers during setup. If you set up on ice, risks of contamination from the ice itself must be managed.
Hot-Start Polymerases are designed so that reactions can be set up at room temperature. An inhibitory molecule blocks the polymerase action until the molecule is first heated in the thermal cycler.
Aliquot out the master mix between all of the PCR tubes, putting 25 µl in each tube.
(DNA template in solution) Add DNA template (1 µl) to all the tubes, being very careful to match the sample #’s to the labels on the tubes. You need to concentrate your attention here and really focus in order to avoid missing a tube or putting two templates in the same tube. Be careful also to change tips between every DNA template
(Colony PCR: DNA in cells). Touch a white tip onto a colony or patch of growth, and pick up a *small* amount of cells. It should be just enough so that you can see there are cells there, not much more than this. Then dip the tip in and out of the master mix in the first PCR tube approx 5 times, and discard the tip. You don’t need to wipe the whole chunk of growth on the inside of the tube, just the dipping in and out action will dislodge enough cells to give you enough template DNA. Less is more in this case ! Repeat for other colonies/patches.
More info in Colony PCR Protocol
Put lids on tubes, ensure they are snapped on tight, place immediately in thermocycler. Double check your program parameters before starting. See below for detailed thermocycling instructions.
Return all reagents to the freezer.
Thermal Cycler Set-up
~~~~~~~~~~~~~~~~~~~~~~~~~~~~~~~~~~~~
Initial denaturation: 95°C, 5 min
~~~~~~~~~~~~~~~~~~~~~~~~~~~~~~~~~~~~
Denaturation: 95°C, 30 sec, 25-35 cycles
Annealing: X°C, 30 sec, 25-35 cycles
Extension: 72°C, Y min, 25-35 cycles
~~~~~~~~~~~~~~~~~~~~~~~~~~~~~~~~~~~~
Final extension: 72°C, 10 min
Hold: 15°C
~~~~~~~~~~~~~~~~~~~~~~~~~~~~~~~~~~~~
The letters that are underlined and in bold indicate variables that need to be optimised for every individual PCR.
X = Annealing Temperature which primers will bind
Rule of Thumb:
X = (Average Tm of Primer #1 and Primer #2) - 5
Good starting point, but only works about half the time in my experience
If you want a second opinion on the Tm calculated by Snapgene/Benchling try the NEB Tm Calculator. It will also recommend a value for your Annealing Temperature (X), which I have found to be reliable.
Other Annealing Temperature calculators:
X will have a range of values, with the centre of that range likely being ideal. ie. you may get some product at 52°C and 56°C, you’ll likely get a better yield at 54°C.
If you have a gradient thermal cycler, you can set up 8-12 master mixes with identical reaction conditions and perform a Gradient PCR to discover the perfect value for X. This is highly recommended for using untested primers as a single day may save you a week’s worth of effort.
If you don’t have a gradient thermal cycler and need to search for X, run a reaction each day with the same conditions, moving up/down from your starting point (Tm-5). I tend to find that (Tm-5) is more often too low, rather than too high - but this is anecdotal experience.
Use a variety of Tm calculators and work your way through the range given by them
Y = Extension Time that the polymerase will need in order to amplify your segment.
Y (minutes/seconds) = Length of Target Gene (bp) ÷ Speed of Polymerase (bp/min)
Start by knowing the exact distance between the 5’ ends of Primer #1 and Primer #2 on your template strand. Next, check the speed of your polymerase in bp/min.
E.G. A 1,200 bp fragment amplified by Taq polymerase (2000bp/min) = 60 seconds
E.G. A 1,200 bp fragment amplified by Pfu Polymerase (500bp/min) = 2 minutes 30 seconds
Always round up to the nearest 30 seconds - Polymerase speed is often measured in minutes and as a result can be a bit inaccurate. Generally adding a bit of excess time will not negatively affect the reaction. On the other hand, underestimating (Y) will cause problems.
Occasionally Extension/Final Extension temperature might change between 68-72°C. It might be worth checking the optimal temperature for your specific polymerase.
But why though?
A standard thermocycling (for Taq polymerase) protocol is given above. It consists of three main phases with the central phase involving three important steps: Denaturation, Annealing and Extension.
Initial Denaturation - Cells in colony PCR are lysed. Double stranded DNA entirely separated into single stranded DNA. Does not change between reactions.
Thermal Cycling - Three step process, repeated 25 - 35 times. Represents the majority of the thermal cycler protocol and is responsible for activating the Polymerase Chain Reaction
Denaturation - As in initial denaturation, the reaction is heated to the temperature at which the DNA is entirely single stranded.
Annealing - The reaction is cooled to a specific temperature (X) at which some of the DNA will still be single-stranded, and some will have reannealed back into double stranded DNA. At this temperature, the primers that you added to your reaction will interfere with the annealing process, binding your target DNA instead of the complementary strand. The Annealing Temperature (X) is Primer Specific.
Extension - The reaction is heated to the ideal operating temperature of your DNA polymerase for a specific period of time (Y) which changes based upon the length of the target and speed of the polymerase. The polymerase will bind the DNA at the points where your primers have bound and begin adding nucleotides according to your template. The polymerase will continue to add nucleotides until the extension step ends. During later cycles, the ratio of original:new template will result in a uniform length DNA product as alternating primers bind the new template. The Extension Time (Y) is Target Specific.
Final Extension & Hold:
The polymerase is given some time to lengthen any fragments of DNA that do not match their corresponding strand.
The thermal cycler enters a cooling stage so that your samples will not evaporate should you leave the lab before the reaction ends.
Does not change between reactions.


Repeated cycles increase the ratio of perfect:imperfect copies of the target region
pcr optimisation tips from nick:
Annealing temperature: This is typically set at 5°C lower than the melting temperature (Tm) of the primers. If these Tm’s are different, use the lower one for this calculation. This calculation is very crude, and it is best to optimise annealing temperature experimentally by doing a ‘gradient PCR’, e.g. testing an annealing temp range from 5° lower to 5° higher than the predicted best temp. Aim to make primers with Tm’s 60-65°C, which gives a predicted annealing temp 55-60°C.
Extension time: This is set primarily by the length of the desired PCR product. For Taq polymerase, this is 1 minute of extension per kb of product. However, note that different polymerases require different extension times: Pfu needs 1.5 min per kb, and Phusion needs 0.5 min per kb. If you use a longer extension time than necessary, you risk increasing the yield of non-specific products; if you use a shorter extension time than necessary, you risk a low yield of the desired product.
Denaturation: The optimal denaturation conditions for Phusion pol are different than for Taq or Pfu. Change the initial denaturation to 98°C - 30 sec, and the denaturation in each cycle to 98°C - 10 sec.
Number of cycles: This can be increased to 35 or even 40 cycles to give a higher yield of product, but this risks introducing more mutations into the PCR amplicons, and also gives a higher chance of secondary non-specific products being formed. Conversely, the # of cycles can be reduced to 25, which will minimise mutations and non-specific products, but will also lower yields.
Hold temperature: Its OK to leave your PCRs in the machine overnight. While some protocols recommend fridge temp (4°C) for this ‘Hold’ step, this is actually bad for the machine – it will accumulate condensation on the block, which will degrade the block over time. A good compromise is to set the hold temp to 15°C, which keeps the samples cool(-ish), maintaining them in good condition, but is not cool enough to cause condensation to form.
PCR Enhancer Additions: Two enhancers that might be worth testing for problematic PCRs are Bovine Serum Albumin (BSA) and dimethylsulfoxide (DMSO). BSA is good for binding inhibitors, and is typically added at 0.5 mg/ml final conc. from a 10 mg/ml stock (=1.25 µl per 25 µl reaction). DMSO is good for enabling amplification of GC-rich templates, and is typically added at 1 µl of neat DMSO per 25 µl reaction (=4%).
Agarose Electrophoresis:
After thermocycling is completed, run your PCR reactions out on an agarose gel to check their size and yield by comparing the size of the bands to a DNA ladder. Typically, we would load 5 µl of PCR mixture. This should give a very strong band if the PCR has been successful. This amount (5 µl) may be hard to quantify if prestaining the gel due to smearing. If you are using this staining method, it’s not a bad idea to run a few different amounts (e.g. 2 µl and 5 µl) to ensure you can accurately size the product.
If you are intending to use the PCR product for cloning, check for the presence of non-specific bands (usually fainter, smaller bands than the expected one) – if these are numerous and/or strong, you may need to try a higher annealing temp, or revisit primer design, before the product can be cloned. Alternatively, you can cut out the desired band from the agarose.
Interpreting PCR Results
While your agarose gel is running, it is good practise to pre-register your hypothesis of what the gel will look like based upon your load order. Snapgene has an excellent tool for simulating agarose gels that will do most of the work for you, but take the time to write down what you’ll expect from each lane. After the gel has been run and imaged on the transilluminator, compare your result to your expectation.
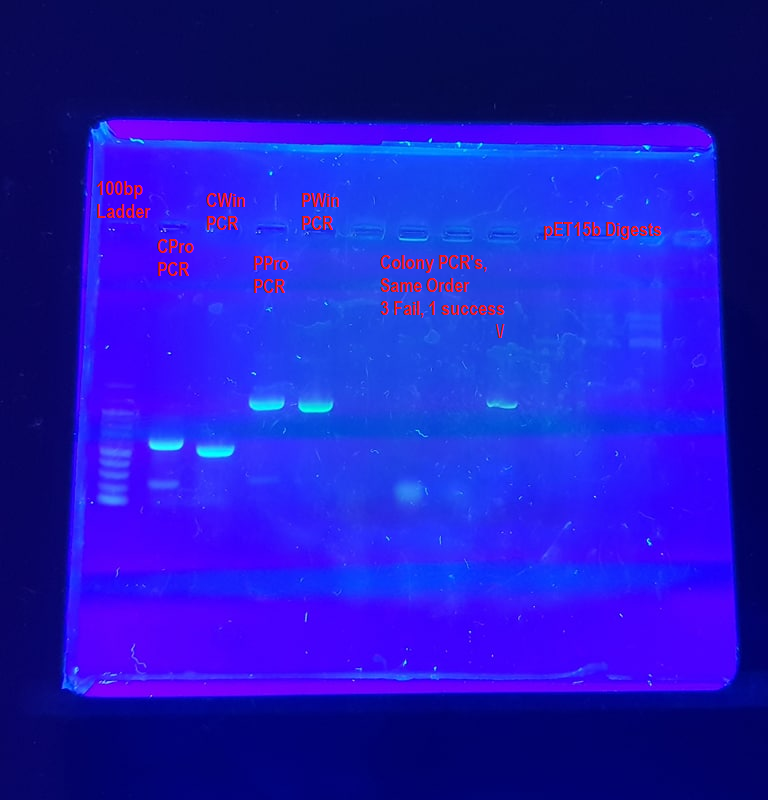
These are some agarose gels of PCR product that I’ve run in the past which we’ll use as an example of how to interpret a gel image. Note that none of these are really ‘publication quality’ agarose gels and contain plenty of fun errors to unpack.
Example 1: A gel of all trades
Lane 1: 100bp Ladder - This ladder is a size standard and allows us to clearly distinguish the size of various genes. Here the ladder is a bit faint and as such another 1-2 µl of ladder might make the gel easier to interpret. A second ladder in land 12, possibly a 1 kb ladder, would also help.
Lanes 2-4: This is a PCR of 4 different Insulin genes contained within pET15b plasmid, FPE7 + FPE8 primers annealing at 58°C and extending for two minutes (120s) with Pfu polymerase. It was well optimised for the PPro and PWin genes, but the extension step was a little too long for the CPro and CWin genes which appear to have a few faint bands of non-specific product underneath them. The PPro and PWin bands look THICC though. Via size comparison to the DNA ladder we can see that the CPro and CWin amplicons are between 500-600 bp in length and the PPro and PWin amplicons are between 900-1000 bp in length.
Lanes 5-8: Colony PCR of cells containing PPro-pet15b plasmid. In a colony PCR, cells are directly added to the tube, rather than purified DNA. Only 1/4 succeeded, which is not surprising considering the fact that Pfu polymerase was used and the cells were a bit old. The waviness of the band is caused by a smaller amount of product (inefficient reaction) as well as cell debris in the reaction tube interfering with progress down the agarose gel. There is a fuzzy RNA band visible near the bottom of lanes 6 and 7. If you see this band a lot during agarose gels of plasmids, you need to buy new RNAse - however it is very normal for a colony PCR, since the reaction contains all the intracellular RNA.
Lanes 9-11: pET15b plasmid digested by three different enzymes. The only notes I have on these is that the concentration was too low to visualise. This is a common problem with agarose gels of restriction digests. You should be able to faintly see 3-4 bands high up in the wells. You aren’t imagining them, these are a good example of bands that are too faint to interpret properly, likely because the sample is too dilute.
General Comments:
This gel probably should have been run for another 15-20 minutes, in order to further distinguish the actual size of the amplicons. As things stand, the bands of the ladder are a bit too close together.
The fuzzy streakiness across much of the gel was due to a poorly cleaned transilluminator which had accumulated a fair bit of dried up dye over the last few months.
Image was of a 1% agarose gel with EtBr stain visualised over a UV transilluminator and photographed with a Galaxy S8+ Smartphone camera and orange filter.
Example 2: A gradient PCR (Annealing Temperature as the variable)
Lane 1: 100 bp Ladder - As in the above gel, this is a size standard. Note how the 500bp and 1000bp bands are thicker, which is a result of more DNA of that size being added to the standard. This helps us easily ensure we didn’t miss a band when counting up from the bottom.
Lane 2-11: Gradient PCR of the CPro Gene (Same as Lane 2 of Example 1) with the annealing temperature increasing left>right from 58.7-68.6°C. As the temperature reaches a point where the primers are no longer reliable binding, the thickness of the band clearly decreases. The “Smiley” effect of the gel (the curve of the bands that should be in a straight line) is caused by current travelling faster along the edges of the gel than in the middle. You can easily make up for this by decreasing the current running through your gel. That said, this was a thiazole orange gel, which we believed had to be run at 200V in order to get the dye to properly intercalate. This may make thiazole orange less useful for publication gels.
Lane 12: 1 kb Ladder - A different size standard, on the far side of the gel. It is good practise to have both ladders, to help identify inconsistency in the travel of current through a gel.
General Comments: Image was of a 1% agarose gel with Thiazole Orange stain visualised over a UV transilluminator and photographed with a Galaxy S8+ Smartphone camera and orange filter. You can faintly see the outlines of the bulbs on the transilluminator behind the gel and also where the dye has gotten stuck in a large crack of the illuminator. Second hand equipment is useable, but doesn’t help with image quality.

Example 3: Thermal Cycler as a variable
Lane 1: 100bp ladder. Gel should definitely have been run for another 20-30 minutes if we really cared about making an accurate prediction of band size.
Lanes 2-9: 8 Identical PCR reactions, run on four machines, with our standard lab thermal cycler as the control. The reaction conditions were poorly optimised, as evidenced by the bands of non-specific product below our target band (~600bp). Nonetheless, since there was plenty of product in our target region, and the non-specific bands are consistent - we can conclude that all three of the machines being tested are heating and cooling correctly.
General Comments: Image was of a 1% agarose gel with EtBr stain visualised over a UV transilluminator and photographed with a Galaxy S8+ Smartphone camera and no filter.

Acknowledgements:
Coleman Protocols 2017 + 2019 http://coleman-lab.org/
UNSW Biotechnology and Synbio coursework
https://www.promega.com.au/resources/tools/biomath/tm-calculator/